Overall Summary
| total time for all requests (real) | 133,656 |
| total time for all requests (req.) | 133,656 |
| total time for all pauses | 0 |
| ratio | 1.0000 |
| total #requests | 240 |
| total #bad requests | 0 |
| total time / total requests (avg. request time) | 556 |
| avg response size in bytes | 38,198 |
| hits per second | 7 |
(y axis = clients, x axis = time)
Runtime Info
| Start Time | 2007-01-01 13:24:41 PST |
| Stop Time | 2007-01-01 13:25:19 PST |
| Duration | 0:37 |
| Load Script | E:\html\stress\url\url_maj.xml |
| # Clients | 4 |
| Repeat Type | Fixed |
| Repeat Amount | 4 |
| Ramp (ms) | 0 |
| Pause (secs) | 0 |
Task Summary (time in ms, size in bytes)
Click on column labels to sort
| task name |
#requests |
#bad |
time: |
min |
avg |
mod avg |
max |
size: |
min |
avg |
mod avg |
max |
| http://www.yahoo.com/ |
16 |
0 |
|
141 |
164 |
163 |
203 |
|
10,777 |
10,778 |
10,778 |
10,779 |
| http://www.google.com |
16 |
0 |
|
281 |
292 |
290 |
328 |
|
4,632 |
4,632 |
4,632 |
4,632 |
| http://www.apple.com |
16 |
0 |
|
218 |
332 |
262 |
1,422 |
|
32,185 |
32,185 |
32,185 |
32,185 |
| http://java.sun.com/ |
16 |
0 |
|
281 |
346 |
344 |
453 |
|
30,569 |
30,569 |
30,569 |
30,569 |
| http://www.verisign.com/index.html |
16 |
0 |
|
296 |
348 |
348 |
391 |
|
32,030 |
32,030 |
32,030 |
32,030 |
| http://www.redhat.com |
16 |
0 |
|
359 |
377 |
377 |
391 |
|
14,800 |
14,800 |
14,800 |
14,800 |
| http://www.dell.com |
16 |
0 |
|
406 |
430 |
428 |
469 |
|
19,279 |
19,279 |
19,279 |
19,279 |
| https://www.verisign.com/index.html |
16 |
0 |
|
390 |
459 |
452 |
625 |
|
32,030 |
32,030 |
32,030 |
32,030 |
| http://www.hp.com |
16 |
0 |
|
390 |
478 |
479 |
547 |
|
66,573 |
66,573 |
66,573 |
66,573 |
| http://www.ibm.com |
16 |
0 |
|
500 |
682 |
651 |
1,297 |
|
25,639 |
25,644 |
25,644 |
25,650 |
| http://www.microsoft.com/ |
16 |
0 |
|
656 |
702 |
695 |
844 |
|
39,273 |
39,273 |
39,273 |
39,273 |
| http://www.sony.com |
16 |
0 |
|
656 |
730 |
730 |
797 |
|
100,550 |
100,550 |
100,550 |
100,550 |
| http://www.slashdot.org |
16 |
0 |
|
593 |
808 |
660 |
3,093 |
|
69,524 |
69,553 |
69,551 |
69,600 |
| W3C (www.w3.org) |
16 |
0 |
|
797 |
963 |
962 |
1,140 |
|
44,072 |
44,100 |
44,101 |
44,117 |
| http://www.oracle.com |
16 |
0 |
|
812 |
1,244 |
1,077 |
4,016 |
|
50,988 |
50,988 |
50,988 |
50,988 |
Task vs. average time
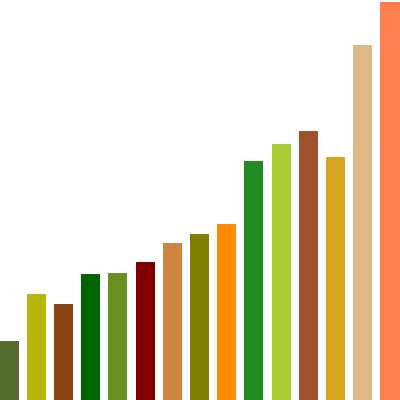
|
Task vs. average size
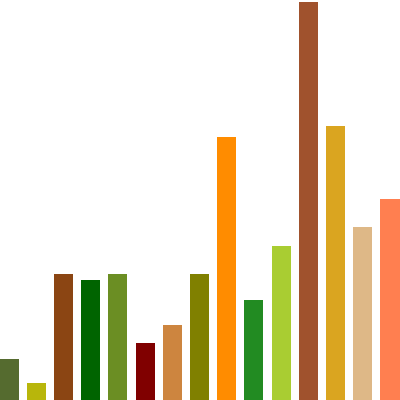
|
Extra (URL) - TBD
(cookie stats) - extra columns above
(image stats) - another table with same rows, more columns
Client Summary
|
min |
avg |
mod avg |
max |
total |
num |
| request stats |
60 |
60 |
60 |
60 |
240 |
4 |
| bad req stats |
0 |
0 |
0 |
0 |
0 |
4 |
| totalRealTime |
31,656 |
33,414 |
32,438 |
37,125 |
133,656 |
4 |
| totalRequestTime |
31,656 |
33,414 |
32,438 |
37,125 |
133,656 |
4 |
Client Details
| client # |
#requests |
#bad |
total real time |
total request time |
total pause time |
| 0 |
60 |
0 |
37,125 |
37,125 |
0 |
| 1 |
60 |
0 |
31,656 |
31,656 |
0 |
| 2 |
60 |
0 |
32,969 |
32,969 |
0 |
| 3 |
60 |
0 |
31,906 |
31,906 |
0 |